Our Animated Visualizations
the fastest method of theme/trend perception
10,000,000 versus 200
Humans evolved and adapted to survive because our brain-eye pattern perception operates incredibly fast. We perceive the outside world at speeds of 10,000,000 bits/second – a huge advantage over reading text at 200 bits/second. Our animated visualizations and Trend Radars leverage this natural neuroscience perception advantage. This 10Mb perception ability empowers our clients to focus their market awareness after our analytics have eliminated 99% of the noise and highlighted potentially interesting themes and relevant events.
There is no black-box here. Our visualizations use graphics, movements and design to guide analysts to immediate drill-downs to actual market signals from originating sources. Data animations that highlight theme developments can be run for 14 days, 14 weeks and 14 months of market activity.
Our Visualization Experience Starts Simply
The initial Trend Radar page starts with a summary of key themes & trends and information that is the result of our discovery analytics. This information can be complemented by analyst insights. If desired, a client can close this layer and interact directly with the Trend Radar below.
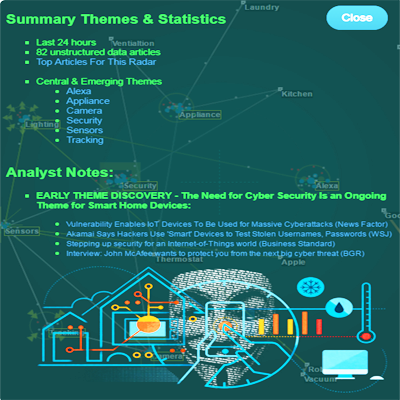
Animated Theme Radar Overview
This theme radar example displays almost all the power of theme discovery and streaming situational awareness. Almost, except for the real-time drill-downs and animations. This radar example is for the smartwatch ecosystem.
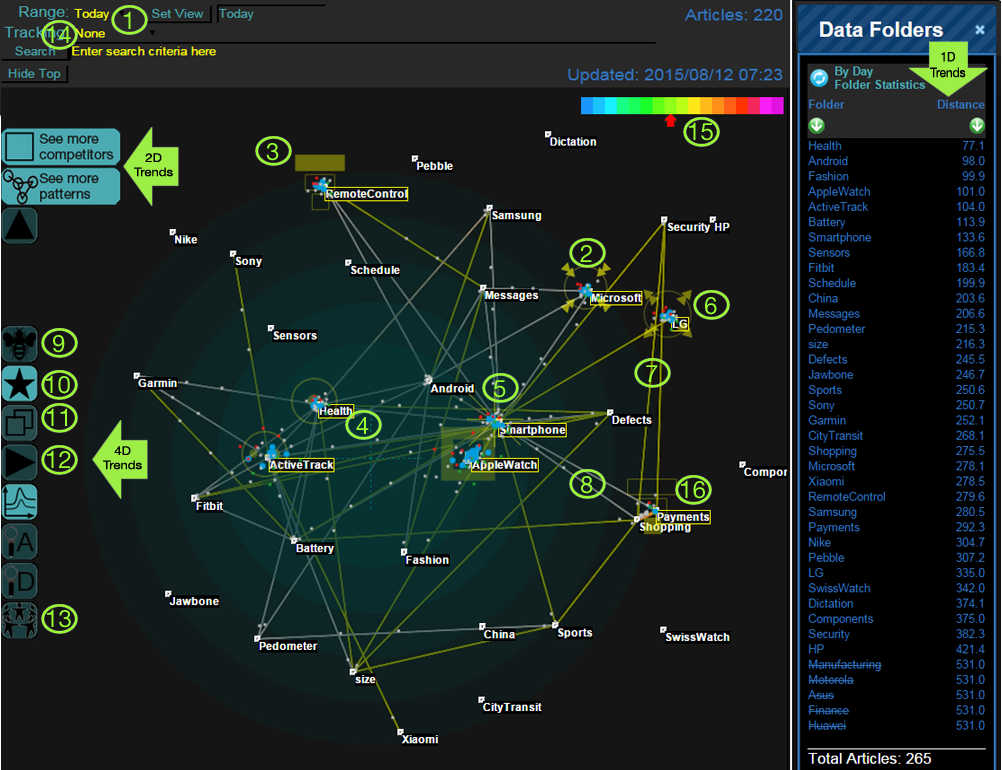
Notes of Theme Radar Operation
- Daily, Weekly, Monthly and Yearly themes & trends
- Emerging as measured by movement toward radar center
- Emerging themes signal based on spike of unstructured data
- Of central importance or relevancy based on winning center of radar
- Of central importance or relevancy based on number and strength of connections and winning center of radar
- Dissipating as measured by movement away from radar center
- New connection over past day
- Strengthening or weakening connections over past week
- Emerging interest of many simultaneous unstructured data creators
- Interesting topics that are markedly different from yesterday
- Seven day movement among other industry or political forces
- 14 day, or 14 week or 14 month animation of movements among players in radar space
- Twitter or community layer as it interacts with traditional unstructured data trends
- Tracking a hypothesis about a expected business or political theme
- Overall energy or activity of entire radar space
- Dissipating trends & themes based on peripheral location and declining unstructured data energy